

Micro housing
Housing Affordability in Australia: A Record Low, and the Size of the Homes We Build
TL;DR: Housing affordability in Australia hit a record low in 2025-26: a median-income household could afford just 12 per cent of the homes sold, and a new mortgage now takes 45.9 per cent of median household income. Part of the problem is what we build. Lone-person households are a quarter of all households, yet studios and one-bedroom homes are under 6 per cent of the stock.
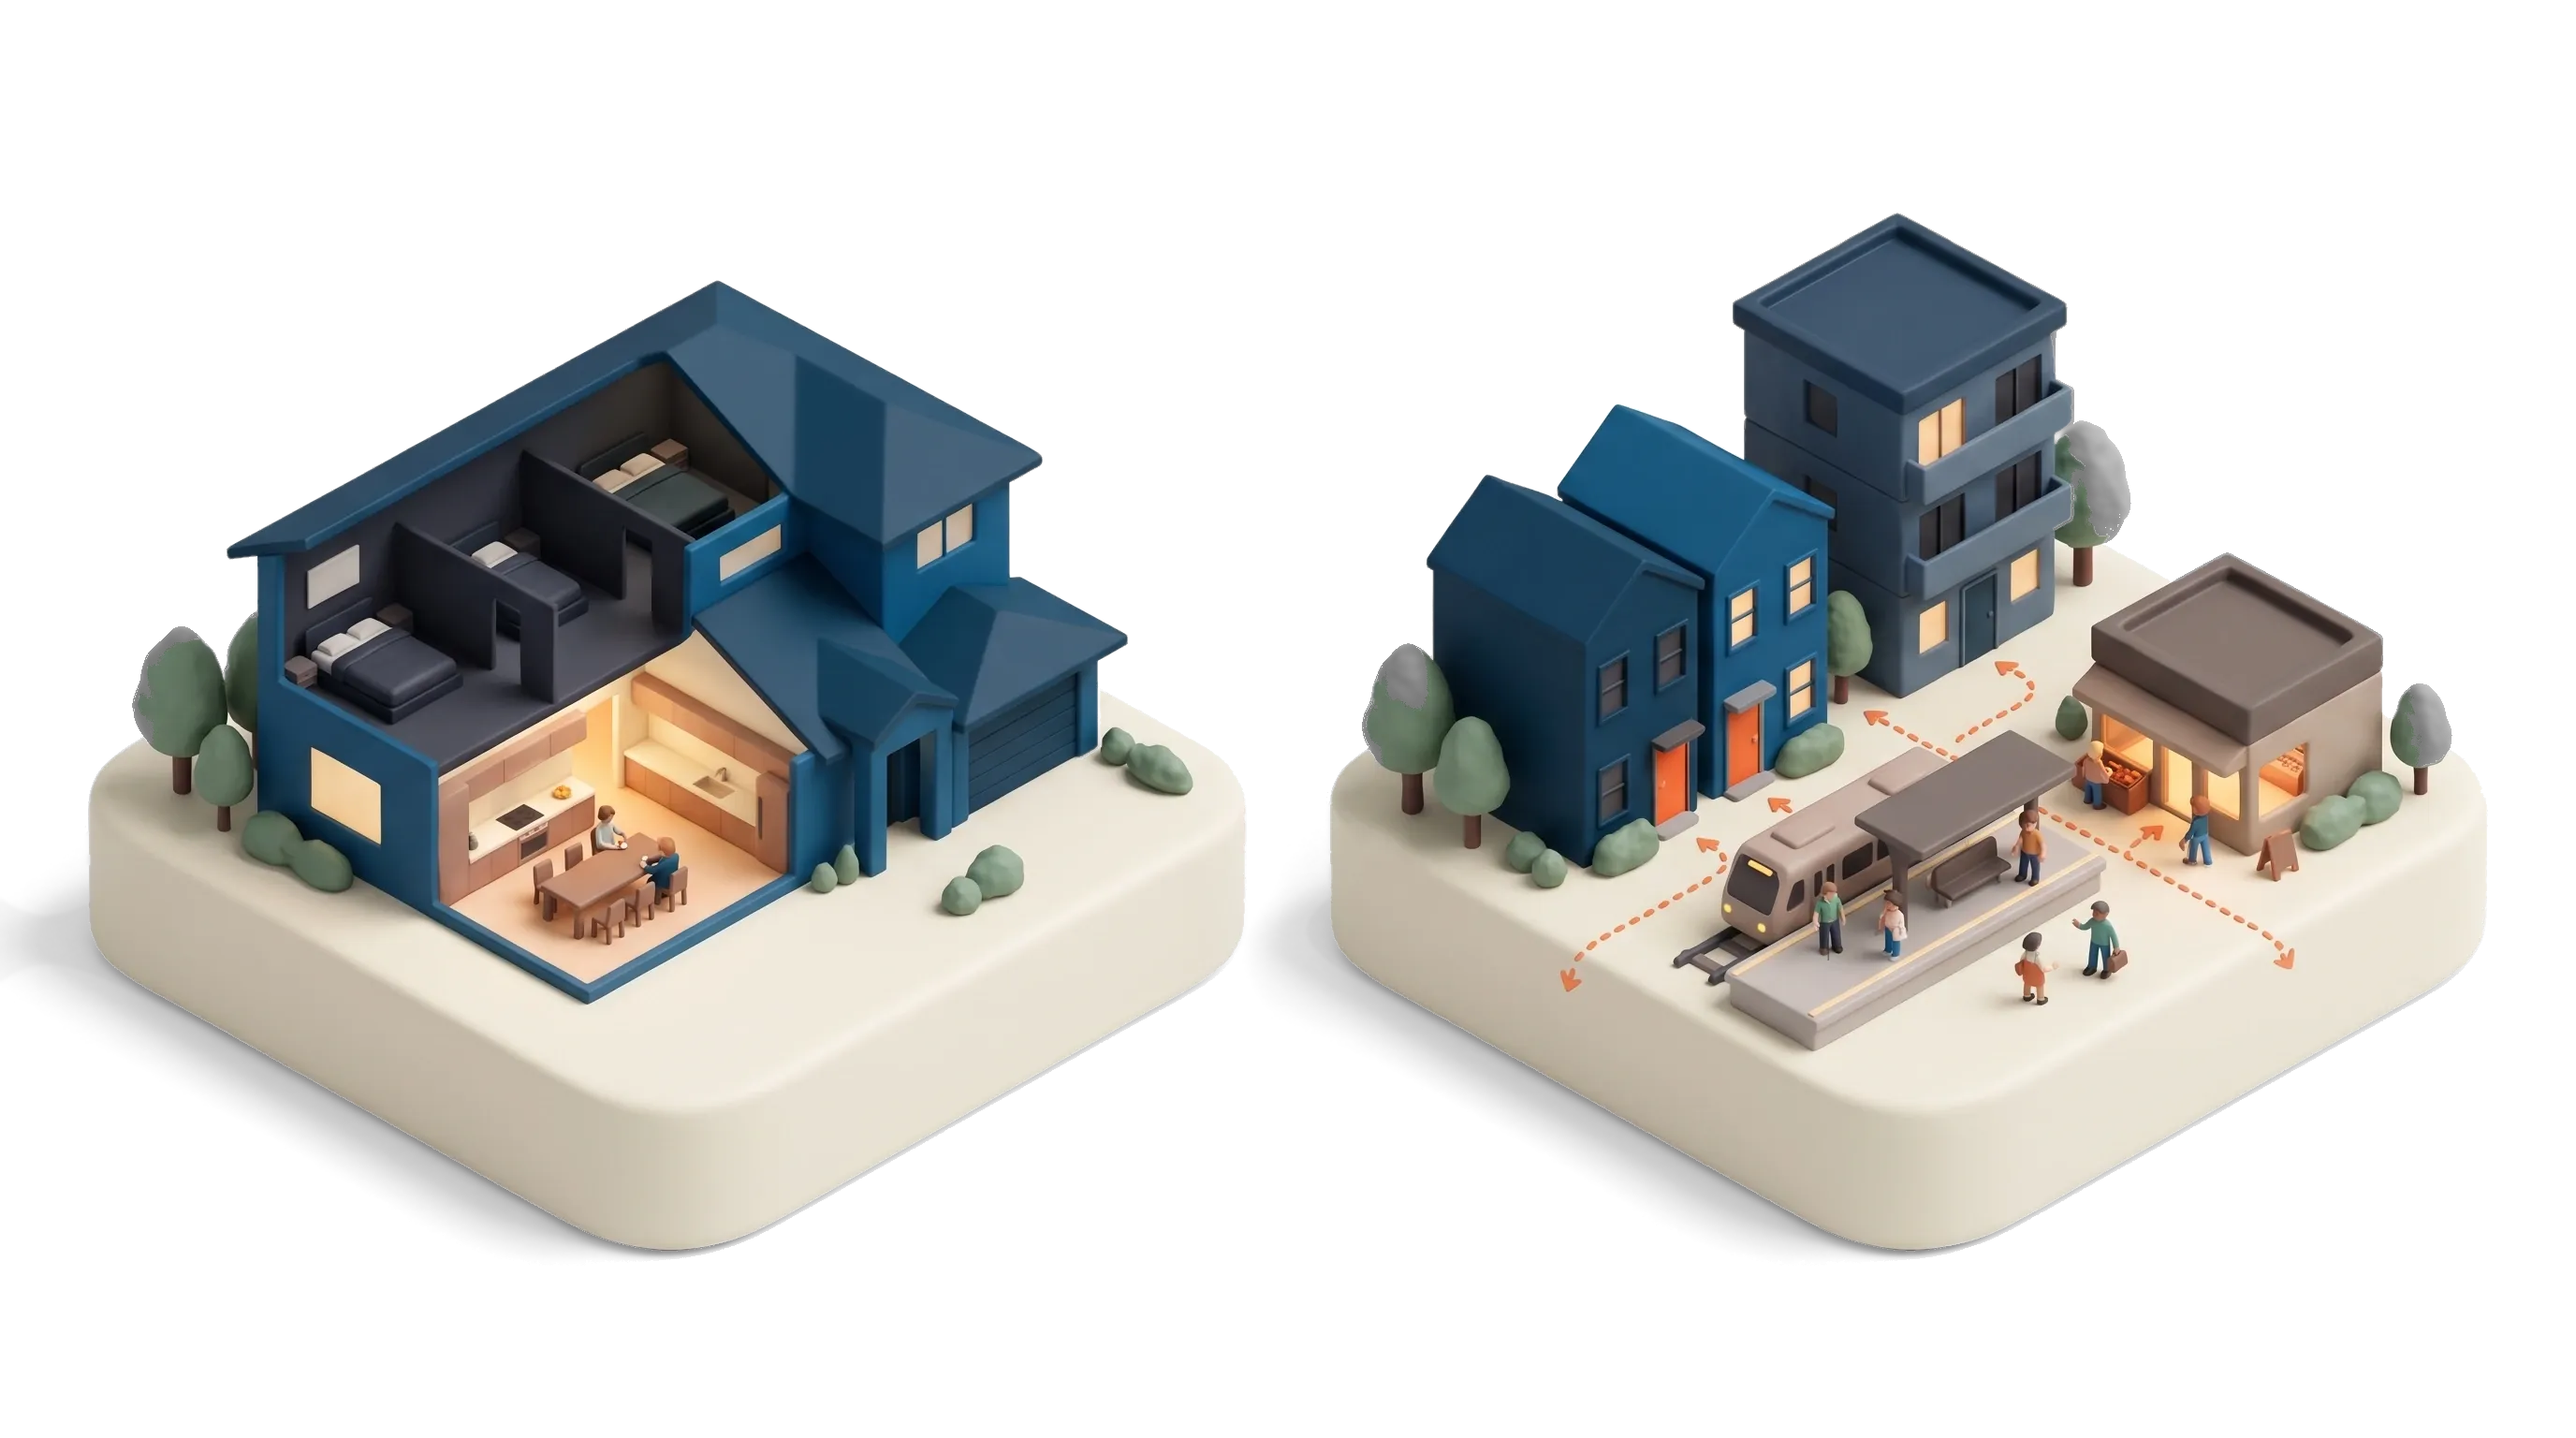

Have you tried to work out what housing affordability in Australia looks like for someone on a median income in 2026?
Do you know how many of the homes sold last year that household could actually afford to buy?
And what if part of the problem is not only the price of our homes, but their size, and where we keep putting them?
It is. Ahead: the affordability numbers that matter and why they disagree with each other, the mismatch between the households Australia has and the homes it builds, why smaller homes are the most attainable rung on the ladder, where those homes do the most good, and the things smaller homes will not fix. It is the affordability chapter of our guide to micro housing in Australia.
Housing affordability in Australia: the numbers that matter
Start with the headline, because it is a genuinely bad one. The realestate.com.au Housing Affordability Report, released on 5 September 2026 and reported by the ABC, found a household on the median income of just over $125,000 could afford 12 per cent of the homes sold in 2025-26. That is the lowest share on record. Five years earlier it was 43 per cent.
The federal government’s own adviser, the National Housing Supply and Affordability Council, tells the same story in its 2026 report, measure by measure:
| Measure | Latest | For comparison | Source |
|---|---|---|---|
| Homes sold that a median-income household could afford | 12% (2025-26) | 43% in 2020-21 | realestate.com.au |
| New mortgage, share of median household income | 45.9% (2025) | NHSAC | |
| New lease, share of median household income | 33.1% (Dec qtr 2025) | 29.1% ten-year average | NHSAC |
| Years to save a 20% deposit | 11.2 (Dec qtr 2025) | 9.0 in 2015 | NHSAC |
| Dwelling price to household income | 8.4 (2025) | NHSAC |
One thing worth knowing before you quote any of them: the measures disagree, and they do so for a boring reason. The realestate.com.au report puts repayments on a median-priced home at 35.5 per cent of average household income, the highest since 1989. The Council uses the median income, which is lower, so it gets 45.9 per cent. Cotality’s November 2025 report lands at 45.0 per cent on its own method. Nobody is wrong. They are measuring against different households, and the median one is the one most people are.
The housing affordability crisis Australia built: homes sized for four
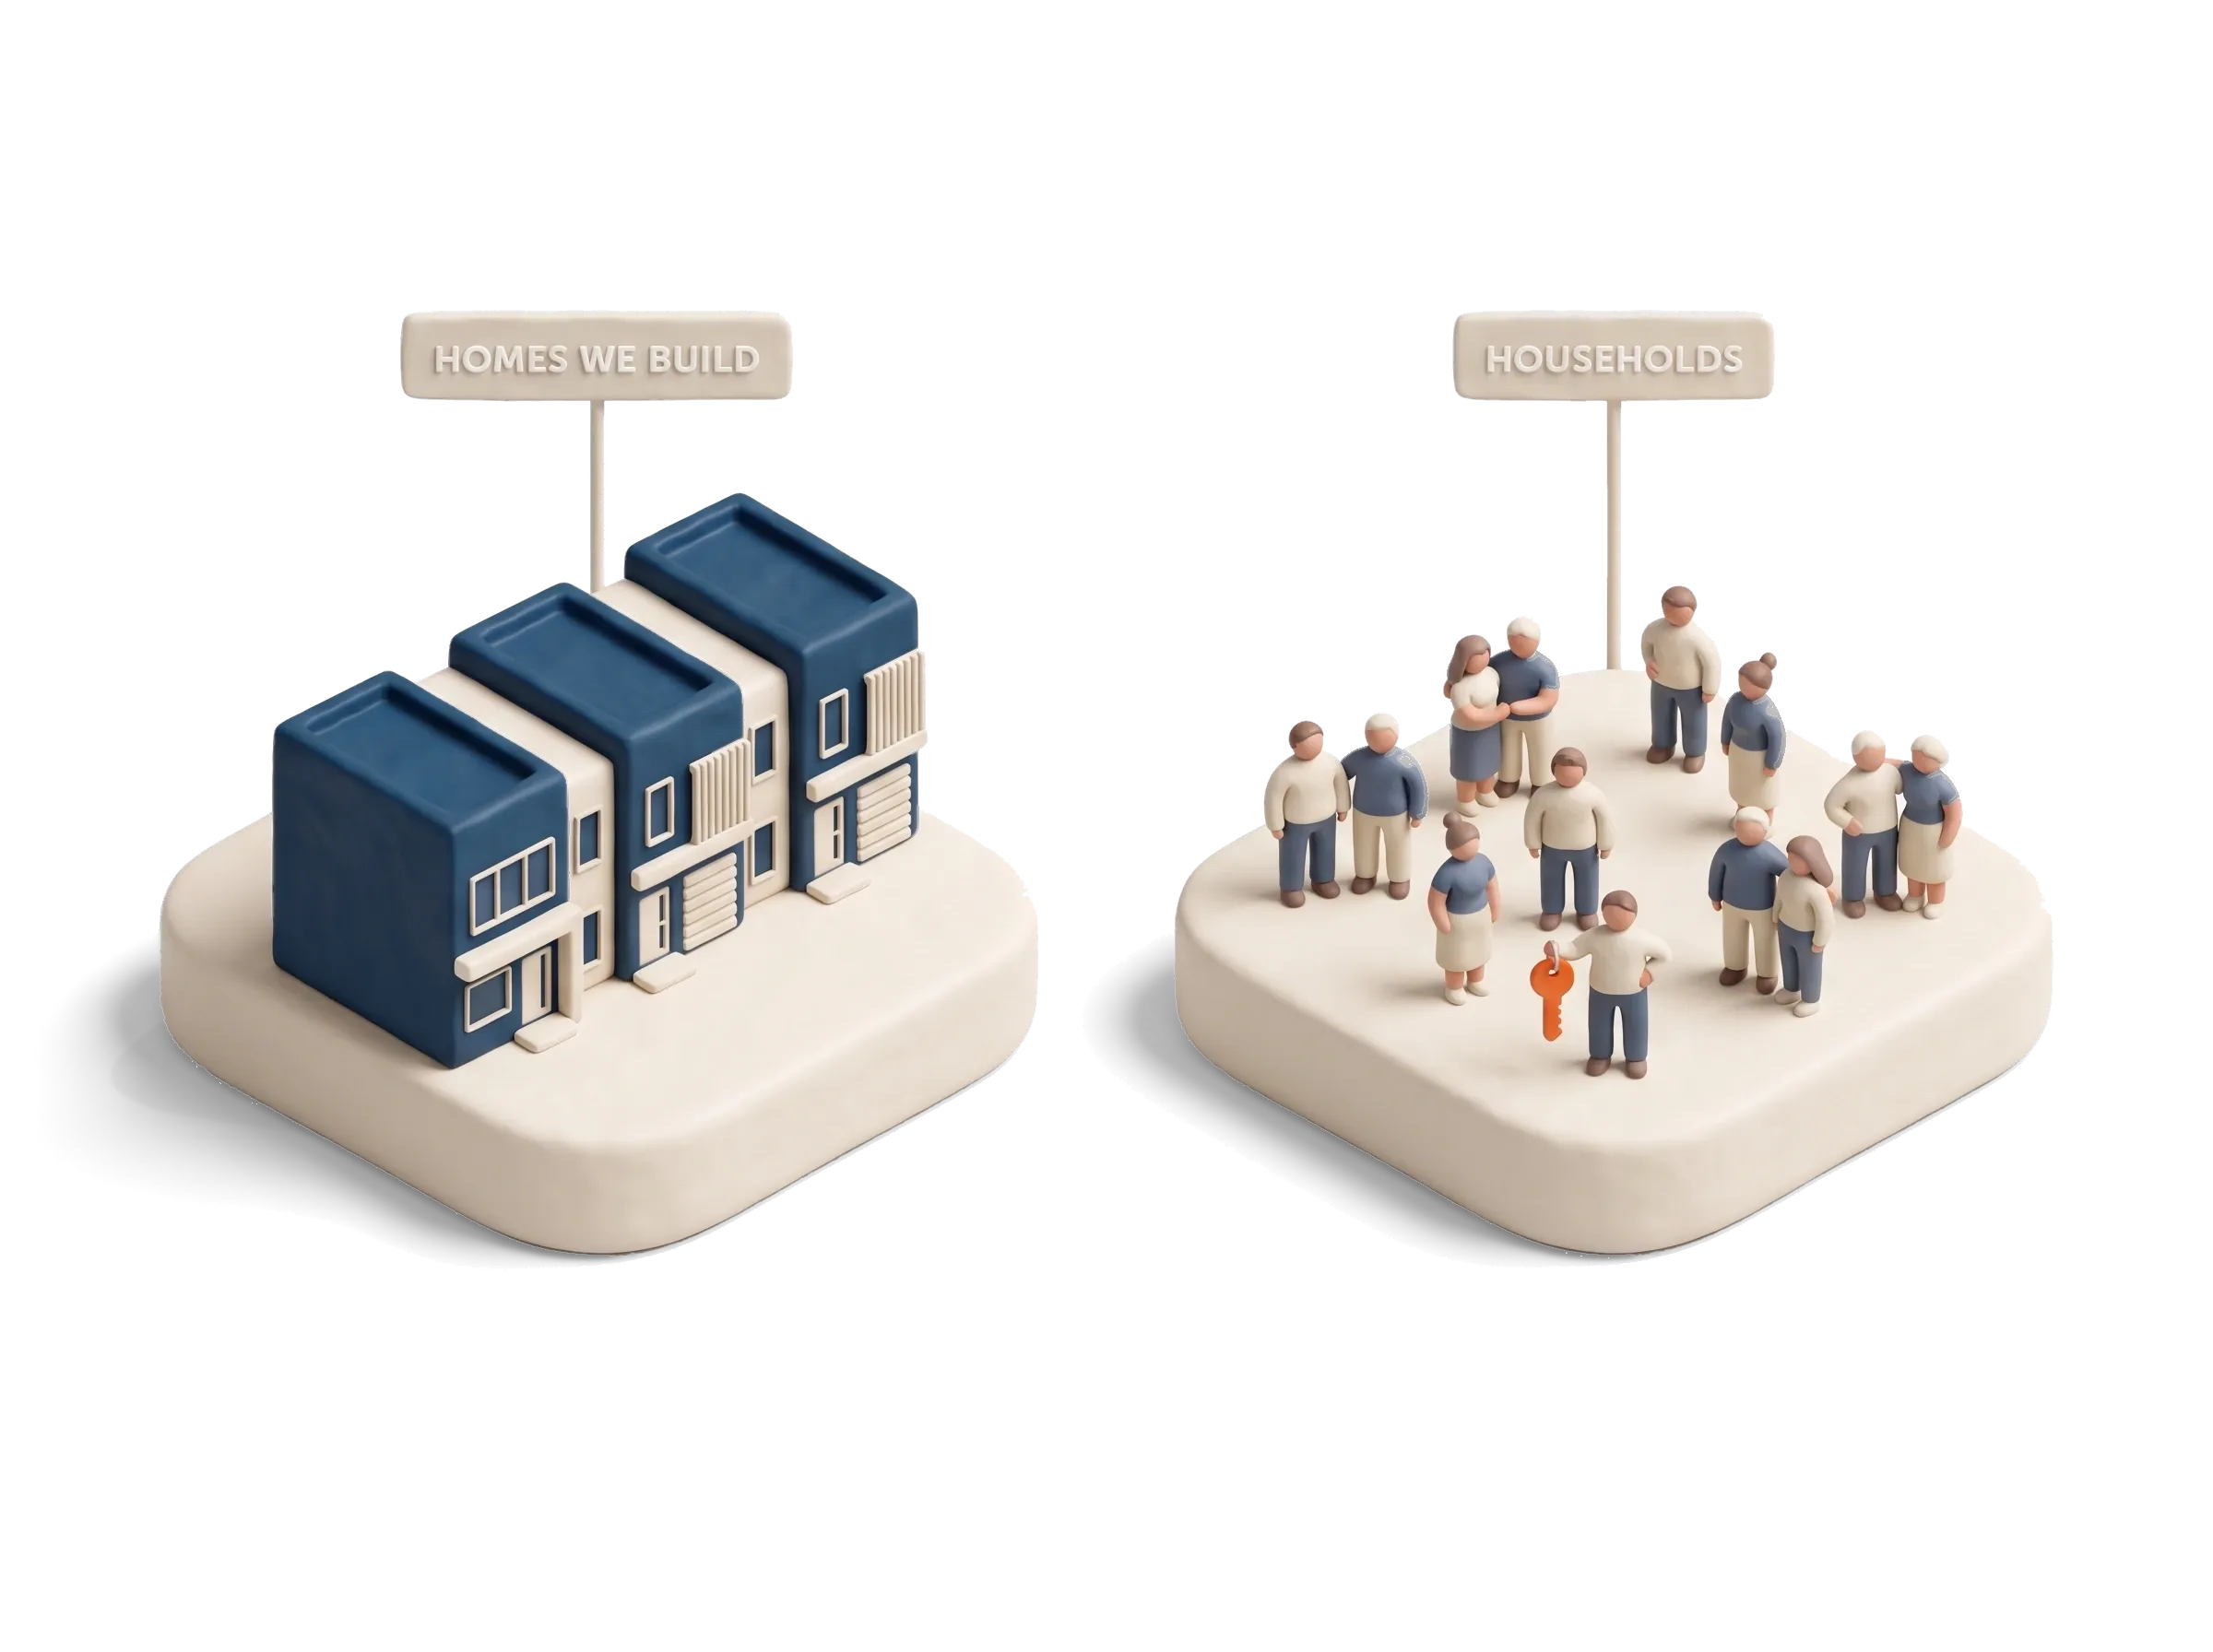
Here is the part of the housing affordability crisis that rarely makes the headline. It is not only what homes cost. It is what we keep building.
At the 2021 Census, lone-person households were 25.6 per cent of all households, up from 24.4 per cent five years earlier. Studios and one-bedroom homes together were 5.8 per cent of occupied dwellings. Homes with four or more bedrooms were 34.8 per cent, and rising. The average dwelling had 3.1 bedrooms for 2.5 people.
The data firm Cotality calls it the great mismatch, and the Council’s own count is blunter: almost 4 million households reported two or more spare bedrooms in 2021. It is not getting smaller on its own, either. The ABS projects that by 2046 between 3.4 and 4.0 million Australians will live alone.
None of that means big homes are the wrong thing to build. Families need them. It means the range is badly skewed, so the person who wanted something small and well located is competing for stock designed for someone else, and paying for the bedrooms they did not ask for.
Smaller homes: the most attainable rung on the ladder
If you want to see what size does to affordability, look at houses and units side by side. Cotality’s November 2025 Housing Affordability Report splits every measure by dwelling type:
| National, Cotality, Nov 2025 | Houses | Units |
|---|---|---|
| Median value to median household income | 8.9 times | 6.7 times |
| Years to save a 20% deposit | 11.9 | 9.0 |
| New mortgage, share of income | 48.7% | 36.8% |
| Rent, share of income | 34.1% | 31.8% |
Nearly three years sooner to a deposit, and a mortgage that takes about 12 percentage points less of the household’s income. That gap is the whole argument for building more small homes, in one table.
It is also why the mismatch matters so much. If the rung that most people can reach is the smaller home, and smaller homes are under 6 per cent of the stock, the ladder is missing most of its bottom half.
Infill housing: where small homes do the most good
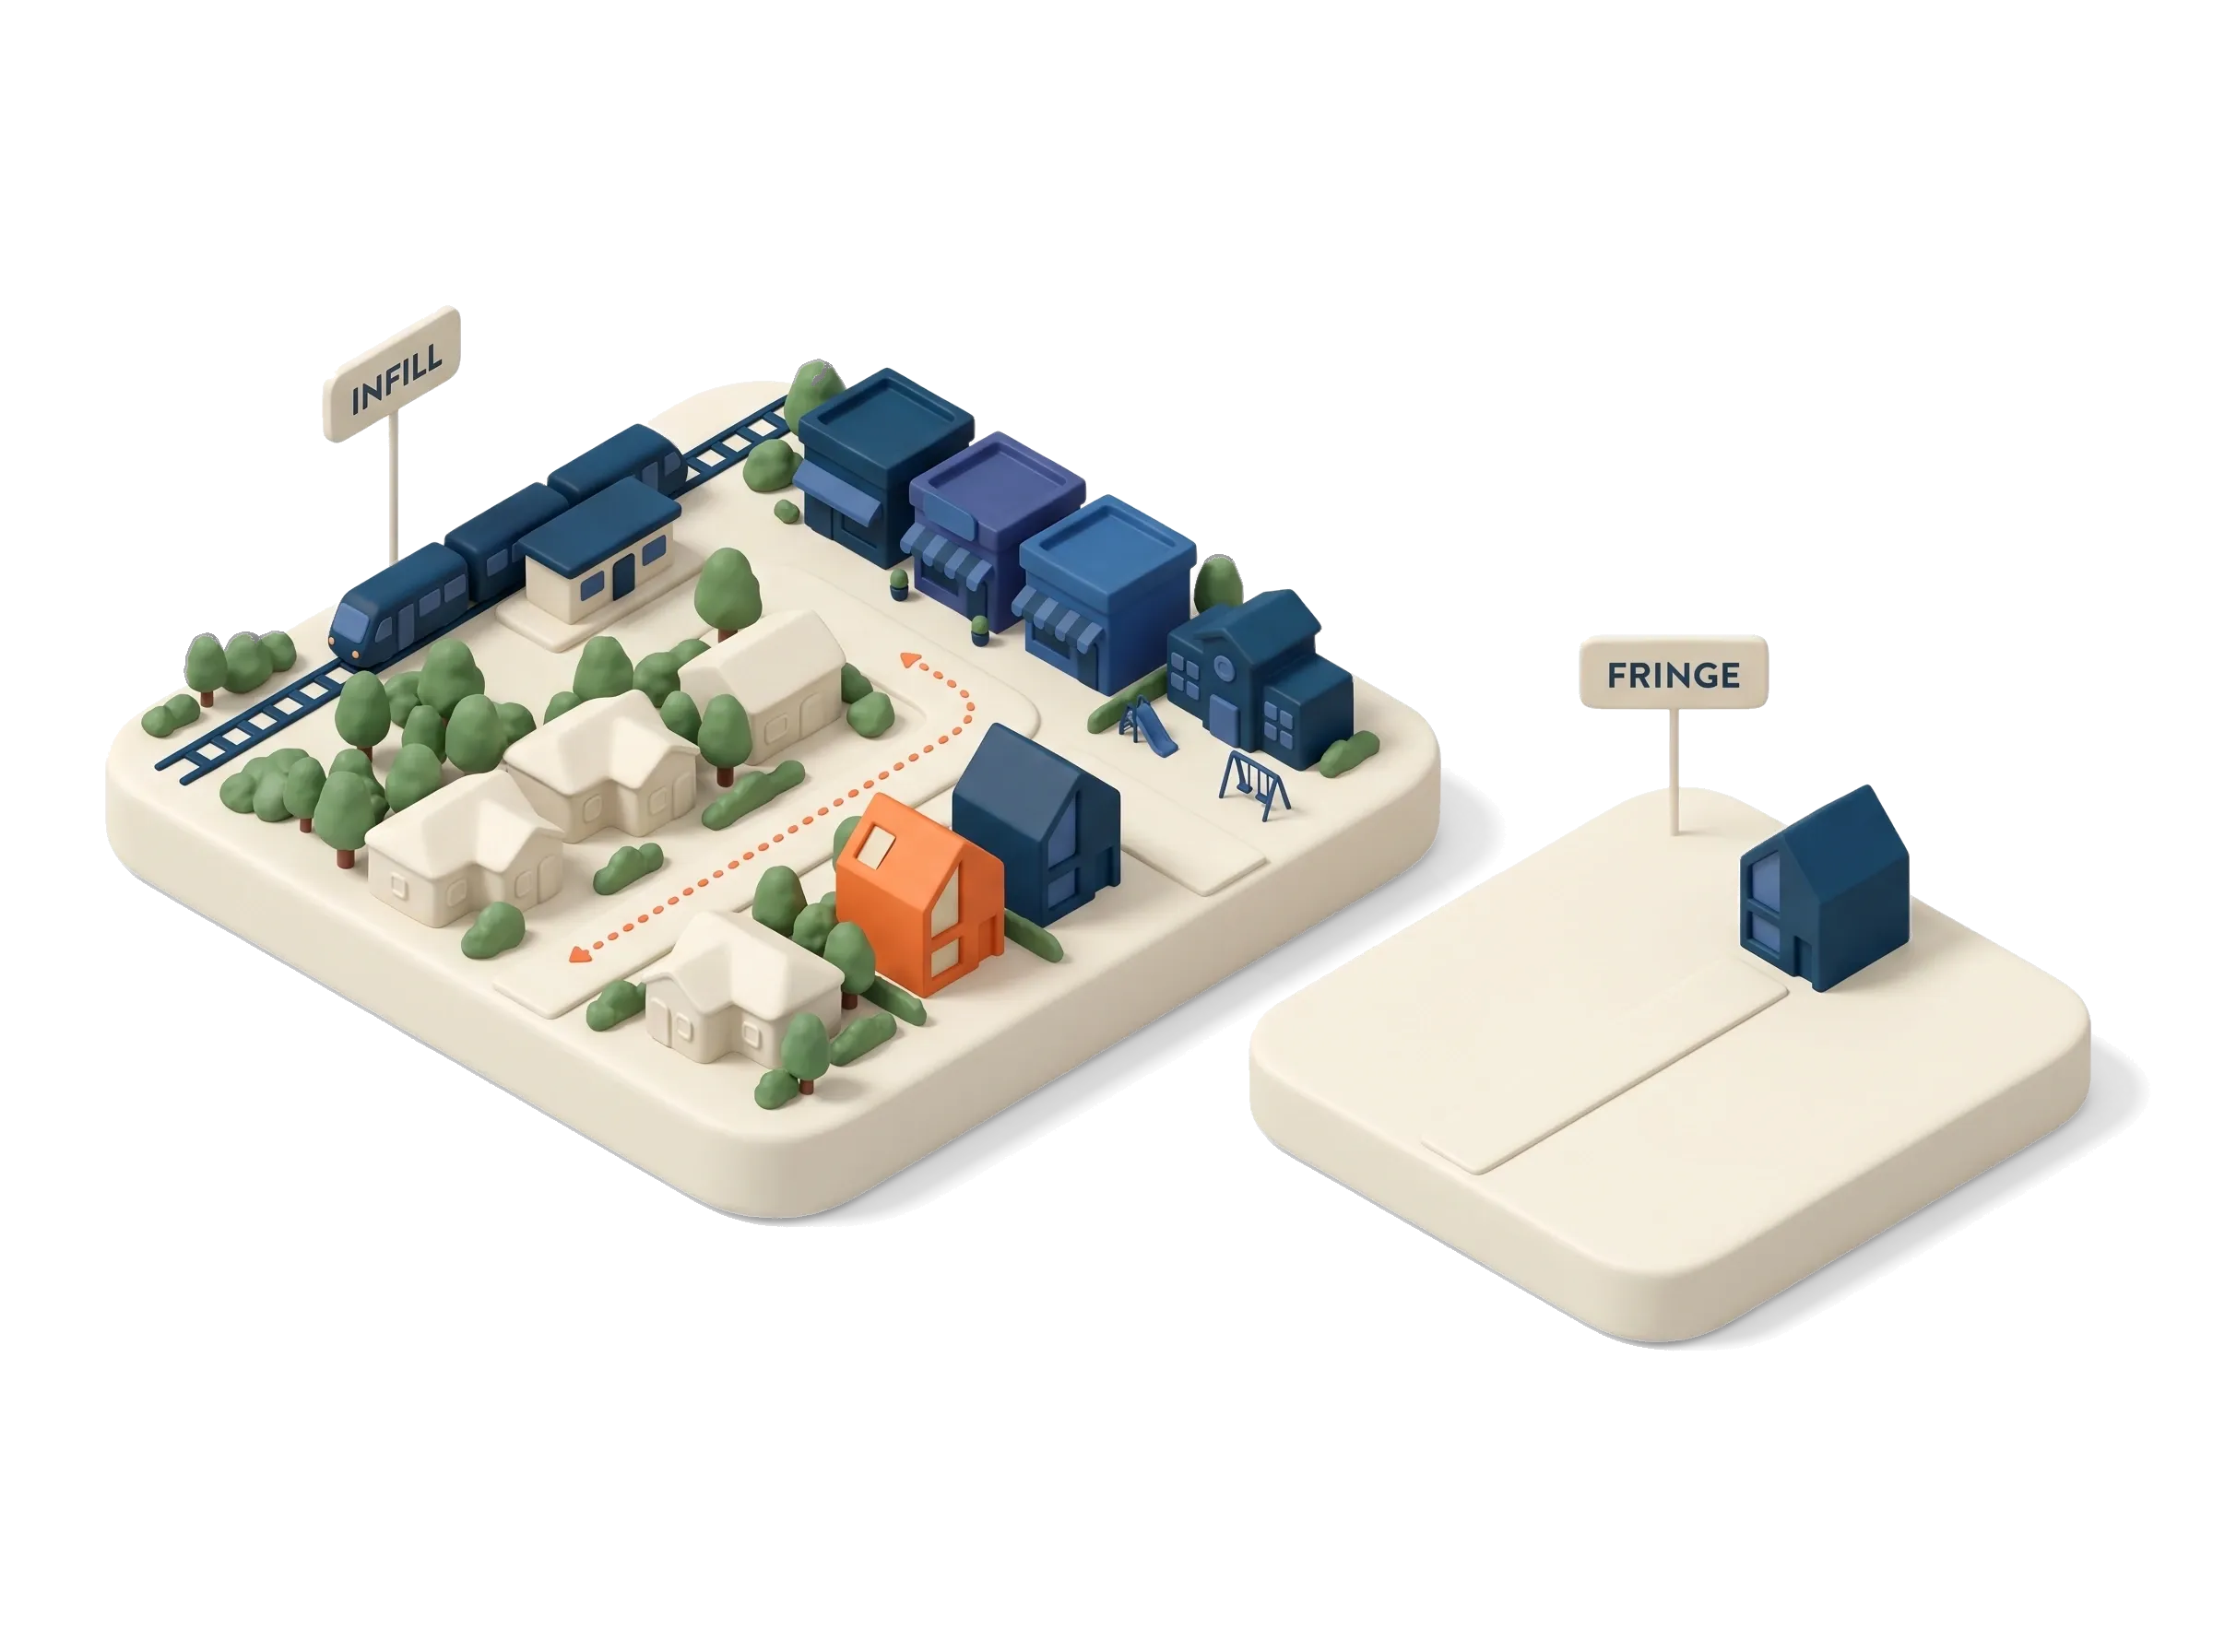
A small home in the wrong place is just a small home. The trade only works when the floor space you give up buys you a location that already has the train, the shops and the school, which is what planners call infill: new homes inside suburbs that already exist.
That location is not a luxury. Infrastructure Victoria found the infrastructure for a new home can cost up to four times as much on the fringe as in an established area. Its figures also show how far behind the plan we are: just 44 per cent of Melbourne’s new homes were built in established suburbs in 2021, against the Victorian Government’s target of 70 per cent. Perth planned for 47 per cent infill and managed about 29 per cent in higher-density infill, as Neil Sipe sets out in The Conversation.
The land is there. What is missing is the middle. When the Australian Housing and Urban Research Institute studied Melbourne’s middle suburbs, it found that most redevelopment replaced one house with one to four homes, one block at a time, and that planning clusters of neighbouring lots together delivered two to four times as many homes as the usual two-for-one dual occupancy (AHURI Final Report 236). The Grattan Institute’s case for allowing three storeys everywhere and six near transport, as the ABC reported, puts a number on the prize: about 67,000 extra homes a year, and around $1,800 a year off the typical rent.
This is where micro apartments and small lots earn their place. A micro apartment or a small-lot pair on an old block puts more homes where the infrastructure already is, and the price of splitting a block, which we lay out line by line in what it costs to subdivide land, is what decides whether it happens.
What smaller homes will not fix
It would be easy to oversell this, so here is the other side.
Small is not automatically affordable. When UNSW’s City Futures researchers looked at the boarding-house micro apartments built under a New South Wales affordable housing policy, they found the rooms mostly went to students and young workers, not the low-income renters the policy was written for. A smaller home only lowers the price for the person living in it when the rules, the location and the numbers let the saving through.
Size does not fix supply, either. The Council expects around 980,000 homes to be built over the Housing Accord period, short of the 1.2 million target, and it puts the gap between new households and new homes at about 37,000 over the same stretch. Smaller homes help that shortfall by fitting more homes onto the same land. They do not make the building cost of each one disappear, and they do nothing about interest rates.
What they do is widen the range. That is a quieter claim than “the answer to the housing crisis”, and it has the advantage of being true.
Where that leaves buyers and investors
If you are buying to live in, the numbers say the smaller home in the better location is the rung within reach, and that the rung is scarcer than it should be. If you are investing, the same numbers point the other way round: a quarter of households live alone, and the homes built for them are a sliver of the stock.
Either way, the gap between what a small home costs to build and what it sells for at retail matters more when every dollar of the budget is already stretched. That is the case we make on buying a new home at developer cost price, and it is why we have designed a 41.36 m² micro apartment you can walk through in 3D. The rest of the topic, from tiny homes to granny flats and co-living, is in our guide to micro housing in Australia.
Frequently asked questions
What share of homes can a median-income household afford in Australia?
About 12 per cent. The realestate.com.au Housing Affordability Report, released in September 2026, found a household on the median income of just over $125,000 could afford 12 per cent of the homes sold in 2025-26, the lowest share on record. The previous low was 14 per cent in 2007-08, and the share was 43 per cent as recently as 2020-21. A household at the 30th income percentile could afford 2 per cent.
How long does it take to save a house deposit in Australia?
The National Housing Supply and Affordability Council puts it at 11.2 years to save a 20 per cent deposit on the median dwelling, as at the December quarter of 2025, against a ten-year average of 9.6 years and 9.0 years in 2015. Other measures give shorter answers because they assume a higher income or a different saving rate, so always check which income a figure uses.
Are units more affordable than houses in Australia?
On every measure Cotality reports, yes. In its November 2025 Housing Affordability Report, the median unit cost 6.7 times the median household income against 8.9 times for a house, a 20 per cent deposit took 9.0 years to save against 11.9, and a new mortgage took 36.8 per cent of income against 48.7 per cent. Smaller homes are the most attainable rung on the ladder, which is why how many of them get built matters.
What is infill housing?
Infill housing is new homes built inside suburbs that already exist, on land that already has roads, transport, shops and schools, rather than on the edge of the city. It ranges from a granny flat or a two-lot subdivision to townhouses and apartments. Infrastructure Victoria found infrastructure for new homes can cost up to four times as much on the fringe as in established areas.
Why do Australian homes have so many spare bedrooms?
Because the stock was built for families and households got smaller. At the 2021 Census the average dwelling had 3.1 bedrooms for 2.5 people, homes with four or more bedrooms had grown to 34.8 per cent of the stock, and the National Housing Supply and Affordability Council counts almost 4 million households with two or more spare bedrooms.
Sources
- Housing Affordability Report 2026 — realestate.com.au (REA Group), accessed September 2026
- State of the Housing System 2026 — National Housing Supply and Affordability Council, accessed September 2026
- Housing Affordability Report, November 2025 — Cotality, accessed September 2026
- 2021 Census QuickStats: Australia — Australian Bureau of Statistics, accessed September 2026
- Choosing Victoria's future: five urban development scenarios — Infrastructure Victoria, accessed September 2026
- Processes for developing affordable and sustainable medium density housing models for greyfield precincts (Final Report 236) — Australian Housing and Urban Research Institute, accessed September 2026