

Market news
Australian Property Market Downturn 2026: What a Buyer's Market Changes When You Buy New
TL;DR: Australian home values fell 0.9 per cent in August and sit 3.6 per cent below the March peak, according to Cotality. PropTrack has a gentler 0.2 per cent fall, Domain called the first quarterly decline in three years, and 93 per cent of capital city suburbs are now going backwards. Three rate rises did it. For a buyer of new stock, the falling market changes the land, not the build cost, so what you pay against end value matters more than ever.


Have you noticed that every headline about the Australian property market downturn quotes a different number, and wondered which one is actually true?
Do you know what a buyer’s market does to a brand-new home, as opposed to the thirty-year-old one next door?
And what if the part of the price that falls in a downturn is not the part you thought it was?
Ahead: the three indices reconciled, why the market turned, the numbers that make it a buyer’s market, the cities pulling in opposite directions, and then the bit the coverage skips, which is what any of this changes when the home you are buying has not been built yet.
This is commentary, not a forecast. The framework behind it lives in where and when to buy or sell residential property.
Australian property market downturn 2026: five months of falls, three ways of counting them
The Cotality Home Value Index for August, released at the start of September, has national dwelling values down 0.9 per cent for the month and 3.1 per cent over the quarter. That is the fifth consecutive monthly fall and leaves values 3.6 per cent below the March peak, with the national median now sitting at $912,885. Annual growth is still positive at 2.7 per cent, but only because the first half of the year was strong.
PropTrack, the research arm of REA Group, also counted a fifth straight monthly fall in August, but a much gentler one: national prices down 0.2 per cent for the month and 2.7 per cent below their March peak, with capital cities 3.6 per cent below theirs. Annual growth on the PropTrack measure is 1.8 per cent.
Domain’s June quarter House Price Report had already called the turn a month earlier. Combined capital city house prices fell 1.4 per cent over the quarter and units 1.2 per cent, the first quarterly decline in more than three years and the end of the longest unbroken run of quarterly growth since 2012 to 2015.
So which number is right? All three, and none of them on their own. Each house builds its index differently, treats new listings and settlements differently, and smooths the month differently, and when a market is turning those differences show up as a gap in the monthly print even while everyone agrees on the direction. Cotality’s research director Tim Lawless put the shape of it plainly: “What started as a more concentrated easing across higher-value segments has now become a much more generalised softening.” Read the three together for the trend. Pick one for the argument and you are just choosing a headline.
Why it turned: three rate rises and a smaller loan
The cause is not mysterious. The Reserve Bank has raised the cash rate three times in 2026, to 4.35 per cent, and held it there at the 11 August meeting. Its own statement noted that “momentum in the housing market has shifted, with housing prices falling in some capital cities and new housing loans declining noticeably,” and that inflation “is still too high” and is not expected to return to the midpoint of the target band until late 2027. In other words, the board is not signalling relief.
PropTrack’s senior economist Eleanor Creagh has been consistent on the mechanism since the first fall landed in April: “Higher interest rates are reducing borrowing capacity, while uncertainty is weighing on confidence.” By August her language had firmed up to buyers being forced “to adjust their expectations.” That is a polite way of saying the loan got smaller, so the offer got smaller.
Domain’s chief of research, Dr Nicola Powell, said the same thing from the other direction: “Three months of data confirm that higher interest rates, affordability pressures and weaker confidence are changing buyer behaviour and bringing the broad-based growth cycle to an end.”
The pattern is worth remembering because it is the same one we wrote about when the rate cycle started, in what a rate move does to a small development. Rates do not hit the market. They hit borrowing capacity, and borrowing capacity hits price with a lag of a few months. We are now in the lag.
Buyer’s market Australia 2026: stock up 24 per cent, sales down 15.5 per cent
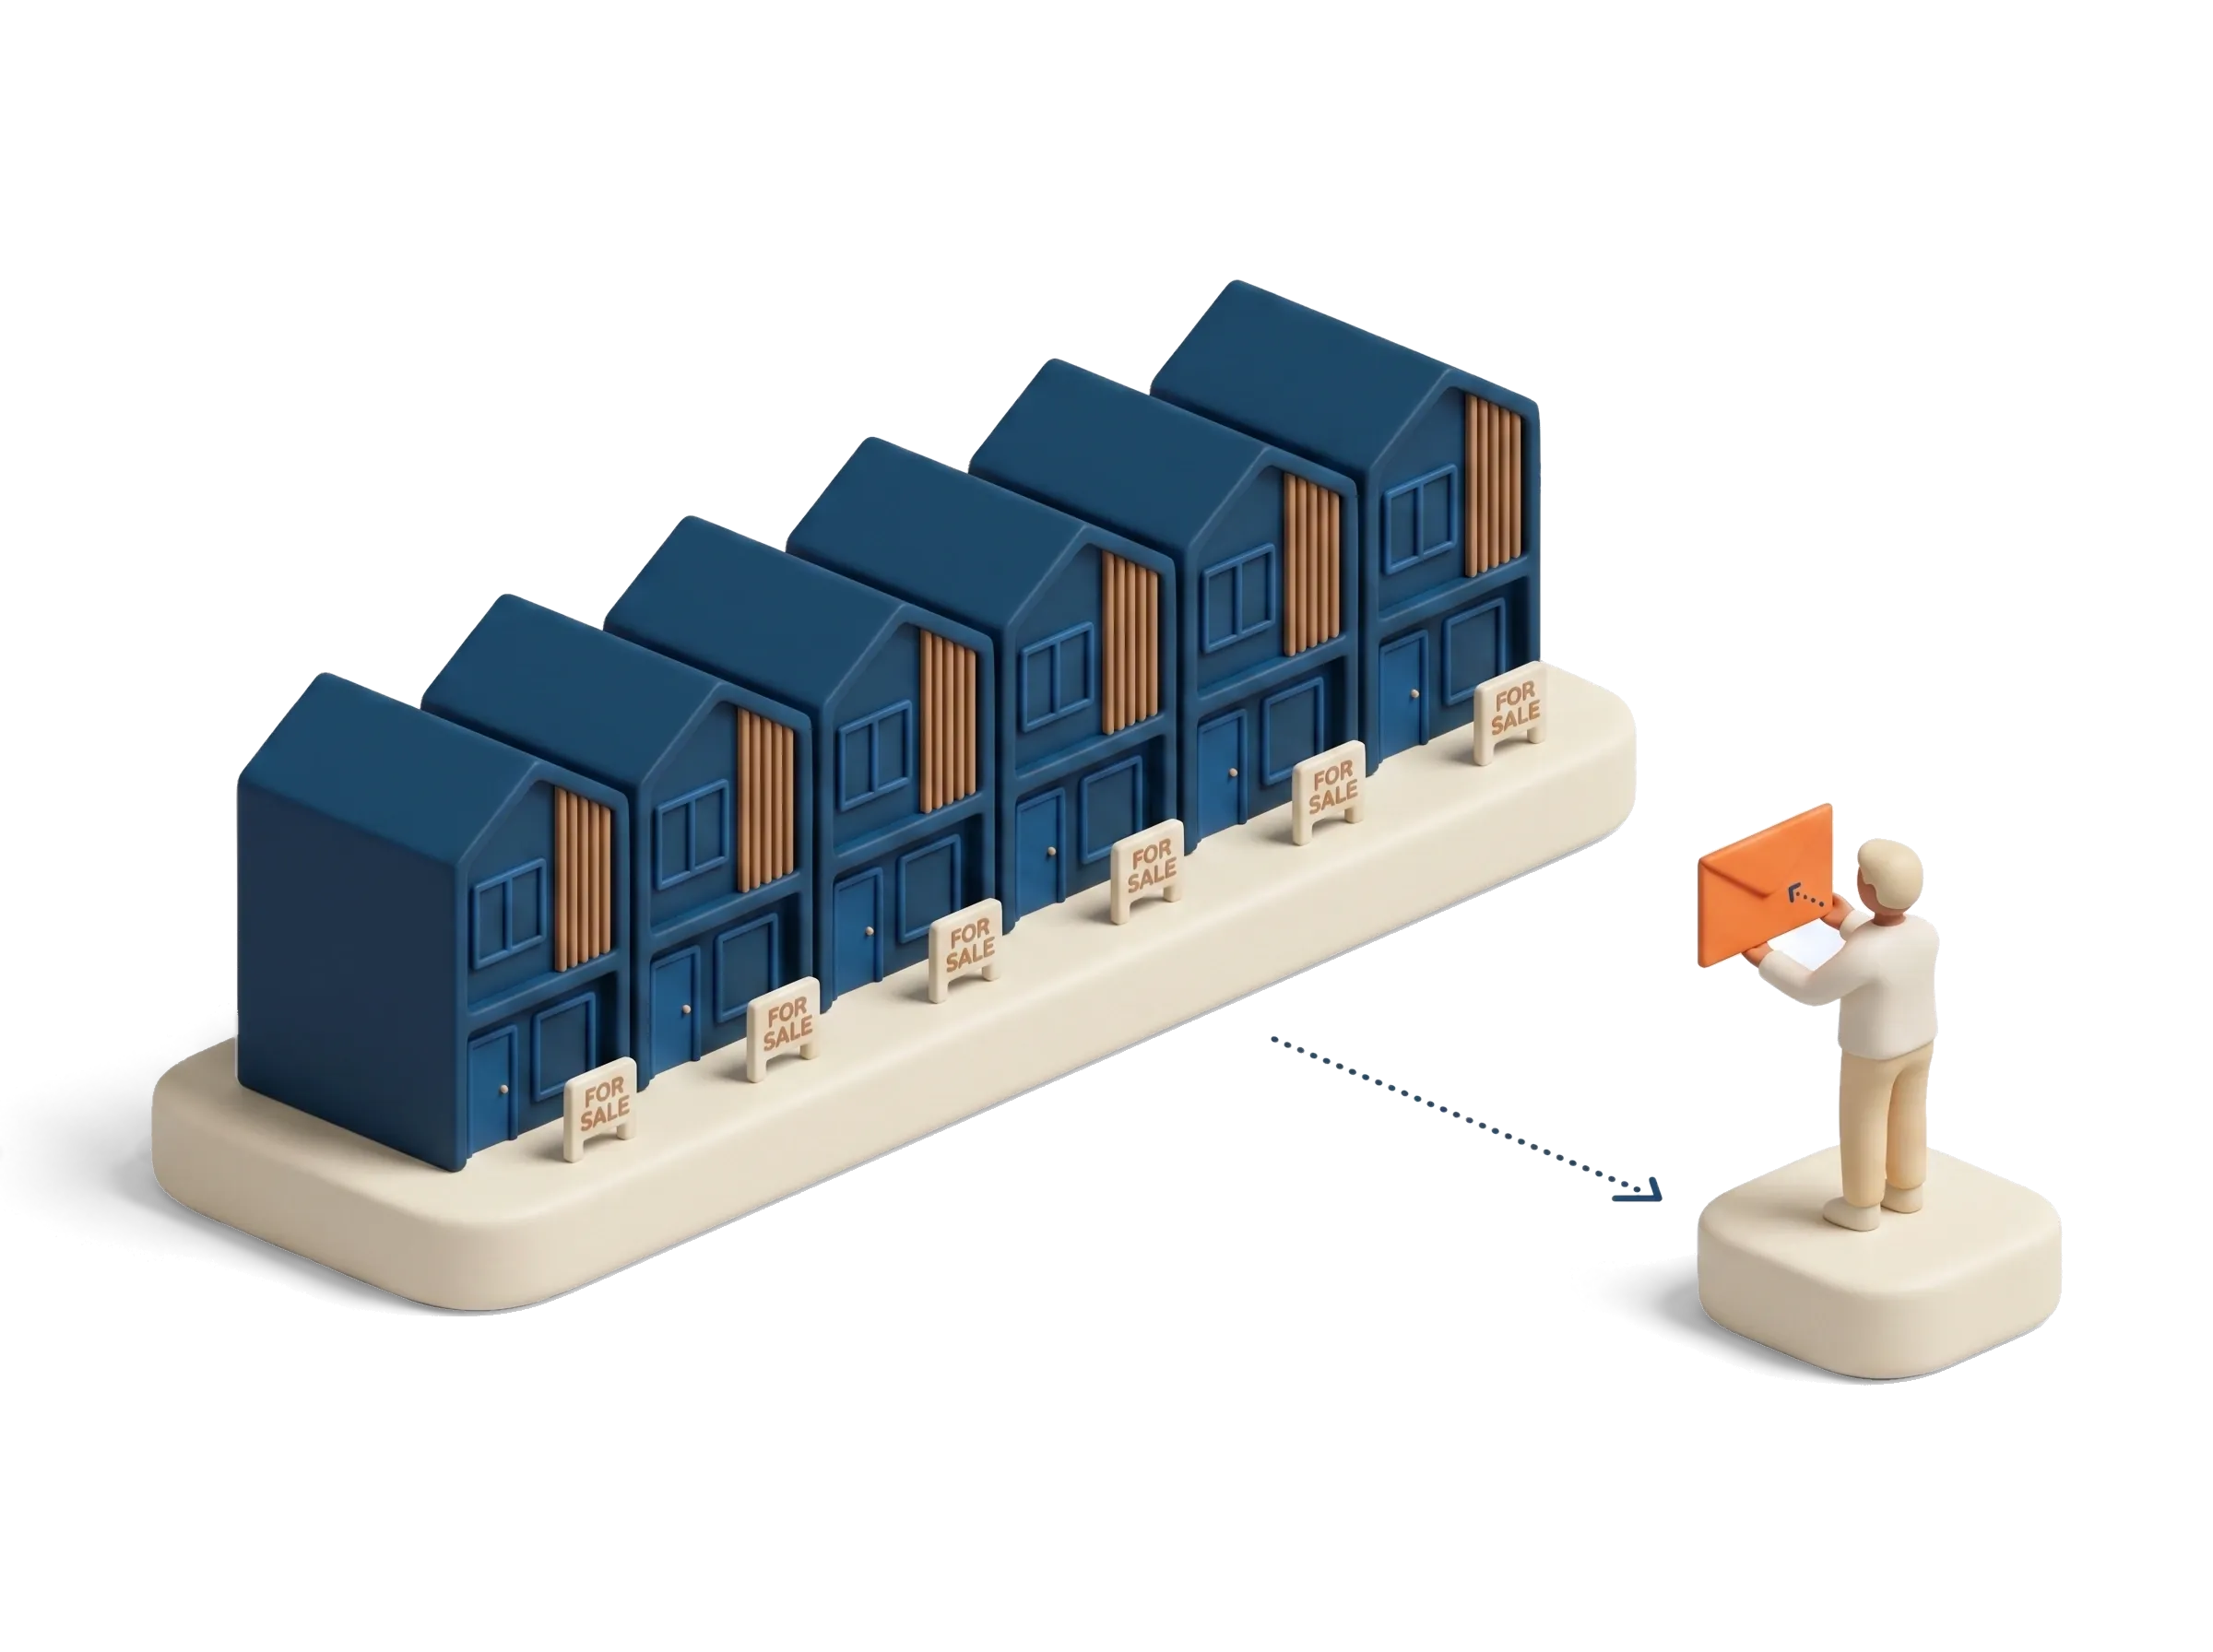
Here is where the term “buyer’s market” stops being a slogan and becomes a set of numbers. Cotality has total advertised capital city listings 24 per cent higher than this time last year and 8 per cent above the five-year average. That is not because vendors are rushing to sell. New listings are actually 6 per cent lower than a year ago. Stock is piling up because it is not clearing: quarterly sales are 15.5 per cent below the same period last year and 11.5 per cent below the five-year average, and auction clearance rates have been stuck under 50 per cent.
Lawless again: “Higher advertised stock levels are simply a factor of a slower rate of absorption. Longer selling times, larger vendor discounting and persistently low auction clearance rates all point to a buyer’s market.”
Selling times up, discounting up, clearance rates down, and roughly a quarter more homes to choose from than a year ago. If you are buying, that is leverage. If you are selling, it is a reason to read buy, hold or sell before you list.
One more number belongs here. The ABS puts the total value of Australia’s housing stock at $12.77 trillion as at the March quarter, the last one before the turn. The June quarter figure, due on 8 September, will be the first official read of how much of that has come off.
Home values are falling in Sydney and Melbourne, and still rising in Darwin
The national figure hides a split. On Cotality’s August numbers Sydney fell 1.4 per cent in the month and is now 7.1 per cent below its February peak. Melbourne and Canberra each fell 1.1 per cent, Brisbane 1.0 per cent, Adelaide and Perth 0.8 per cent. Darwin rose 0.6 per cent and is up 14.6 per cent over the year. Regional Australia fell 0.4 per cent for the month, roughly half the capital city pace.
Annual growth tells you where each city came into the downturn from. Sydney and Melbourne are already negative over twelve months, at 4.6 and 4.7 per cent down. Brisbane is still up 10.8 per cent, Adelaide 8.6 per cent, Perth 15.6 per cent. The cities with the biggest run-up are giving back gains; the cities that never had the run-up are giving back very little, so far.
Powell’s line on it is the one to keep: “Australia is no longer moving as a single housing market.” It never really did, which is the entire reason Boomscore exists, and we have a separate post on reading Boomscore data to find the suburbs still moving. This post is about the other half of the decision: what a falling market does to the price of a home that has not been built yet.
What a falling market changes when you buy new rather than established
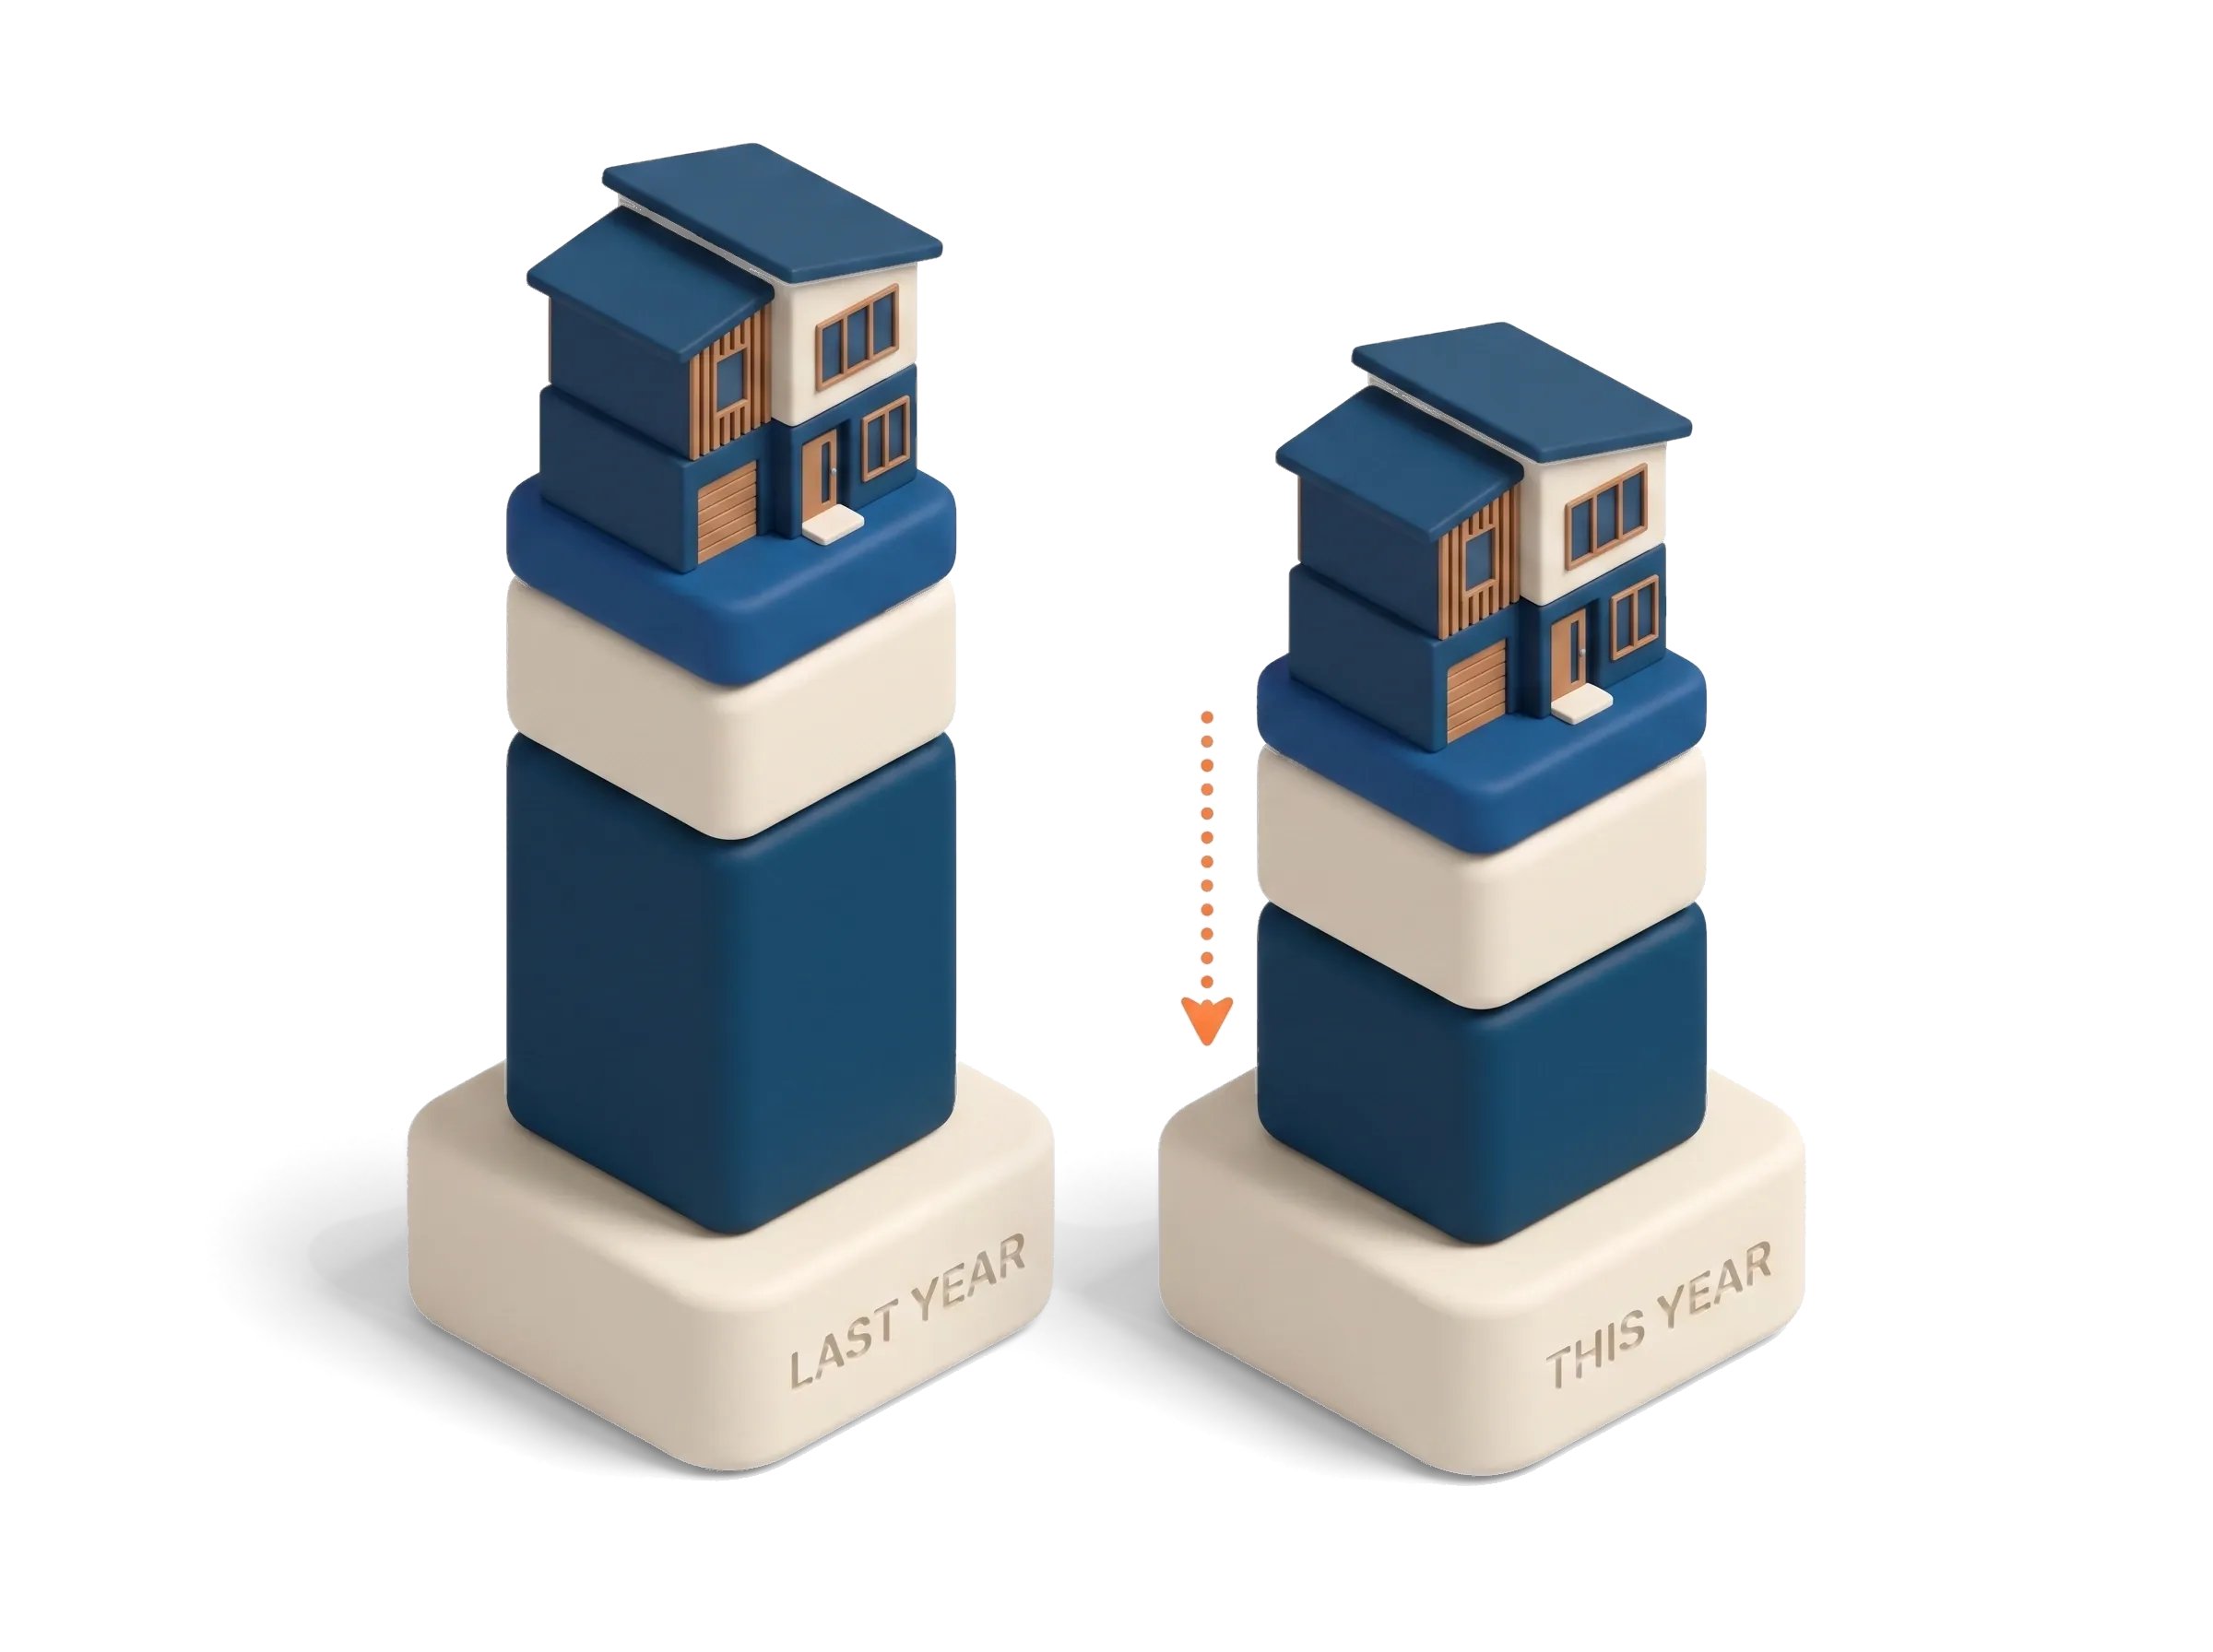
An established home has one price and it moves with the market. When Cotality says Sydney is down 7.1 per cent from peak, the thirty-year-old house on the corner is down something like 7.1 per cent, full stop.
A new home is priced differently. Underneath its retail price sit three things: the land, the cost of building on it, and the developer’s margin. In a downturn those three do not fall together.
The land falls. A developer works out what a site is worth by starting at the finished value and subtracting everything it costs to get there, which is the residual land value. When end values drop, that residual drops with them, and often faster, because it is the bit left over.
The build cost does not. Domain’s Powell noted that “elevated construction costs continue to support prices.” The ABS building approvals data puts the average value of an approved house at $517,430 in 2025-26, up 5 per cent on the year before, in the same twelve months that prices turned. Nobody has told the builders there is a downturn on.
The margin gets squeezed between them. That is the retail margin, the gap between what a completed home costs to create and what it sells for. Falling end values and rising build costs narrow it from both sides. Some projects stop stacking up and never start, which is why supply tends to dry up a year or two after a downturn, right when the next upswing needs it.
Put those together and the practical answer is a little uncomfortable. A falling market makes established property cheaper in a straight line. It makes new property cheaper only through the land, while the build gets dearer, so the headline discount does not fully reach new stock. What does change is the value of getting in at the right layer. Buying a new home at developer’s cost price, which is land plus build without the retail margin on top, means the buffer against a soft market is built into the entry price rather than hoped for from the cycle. In a rising market that buffer is nice. In a market like this one, it is the whole point.
It also happens to be the answer to the supply problem the data is describing. Fewer projects starting means fewer homes finishing, and the way through is not to wait for the cycle but to bring new stock to market at a price that works when the cycle does not: micro apartments, small-lot townhouses and integrated developments that pencil at today’s end values, not last year’s.
The takeaway: check the layer, not the headline
None of this is a crystal ball. Five months of falls is a trend, not a destination, and the same rate board that caused it can reverse it. But the direction of travel is clear enough that pretending otherwise is not analysis, it is hope.
If you are buying established, you are buying the headline number, and the headline number is falling. If you are buying new, the land is falling, the build is not, and the price you enter at relative to the finished value is doing most of the work. The number to check is not how far the market has fallen. It is how much of the retail margin you are paying for.
More reads: what the 2027 negative gearing rules count as a new build · rental yields are at a seven-year high while prices fall · the pillar hub: property market news.
General information only. Nothing here is financial, credit or tax advice, nor an offer of any financial product, and market commentary is not a forecast. Past results are not a promise of future performance. Speak with your own licensed adviser before acting.
Frequently asked questions
Is Australia in a property downturn in 2026?
Yes, by every major measure. Cotality's Home Value Index fell 0.9 per cent in August 2026, the fifth monthly decline in a row, PropTrack recorded a fifth straight monthly fall, and Domain's June quarter report logged the first quarterly decline in combined capital city prices in more than three years. The Reserve Bank has raised the cash rate three times in 2026 to 4.35 per cent, which is the main reason.
How far have Australian home values fallen from their peak?
It depends on whose index you read. Cotality puts national values 3.6 per cent below the March 2026 peak, with Sydney 7.1 per cent below its February high. PropTrack has the national figure 2.7 per cent below its March peak, with capital cities down 3.6 per cent. Regional markets have fallen far less on both measures.
Why do Cotality and PropTrack report different price falls?
They measure the same market with different tools. Each index uses its own model, its own treatment of new listings and settlements, and its own way of smoothing the month. When the market is turning, those differences show up as a gap in the monthly figure even while both indices agree on the direction. Read them together for the trend rather than picking the one that suits the argument.
Is 2026 a buyer's market in Australia?
Cotality says so directly. Advertised stock is 24 per cent higher than a year ago, quarterly sales are 15.5 per cent lower, auction clearance rates are stuck below 50 per cent and selling times and vendor discounting are both increasing. Those are the classic conditions where a buyer has more choice and more negotiating room than a seller.
Does a falling market make a new build cheaper to buy?
Only the land part. A new dwelling is priced off land, build cost and the developer's margin. Land value falls when the market does, but construction costs have kept rising, with the ABS putting the average approved house value at $517,430 in 2025-26, up 5 per cent. So the discount a falling market delivers to new stock is smaller than the headline suggests, which is why the price you enter at relative to end value matters more than the cycle.
Sources
- Home Value Index, August 2026 results — Cotality, accessed September 2026
- National home values slip 0.9% in August, Sydney leads falls: Cotality — Capital Brief, accessed September 2026
- PropTrack Home Price Index — PropTrack (REA Group), accessed September 2026
- House Price Report, June 2026 — Domain, accessed September 2026
- Australia's Housing Boom Ends: First Quarterly Price Fall in More Than Three Years — Domain (media release), accessed September 2026
- Statement by the Monetary Policy Board: Monetary Policy Decision, 11 August 2026 — Reserve Bank of Australia, accessed September 2026
- Dwelling approvals rise in June 2026 — Australian Bureau of Statistics, accessed September 2026